This div is used to preload the font
Plugin Analysis
Overview
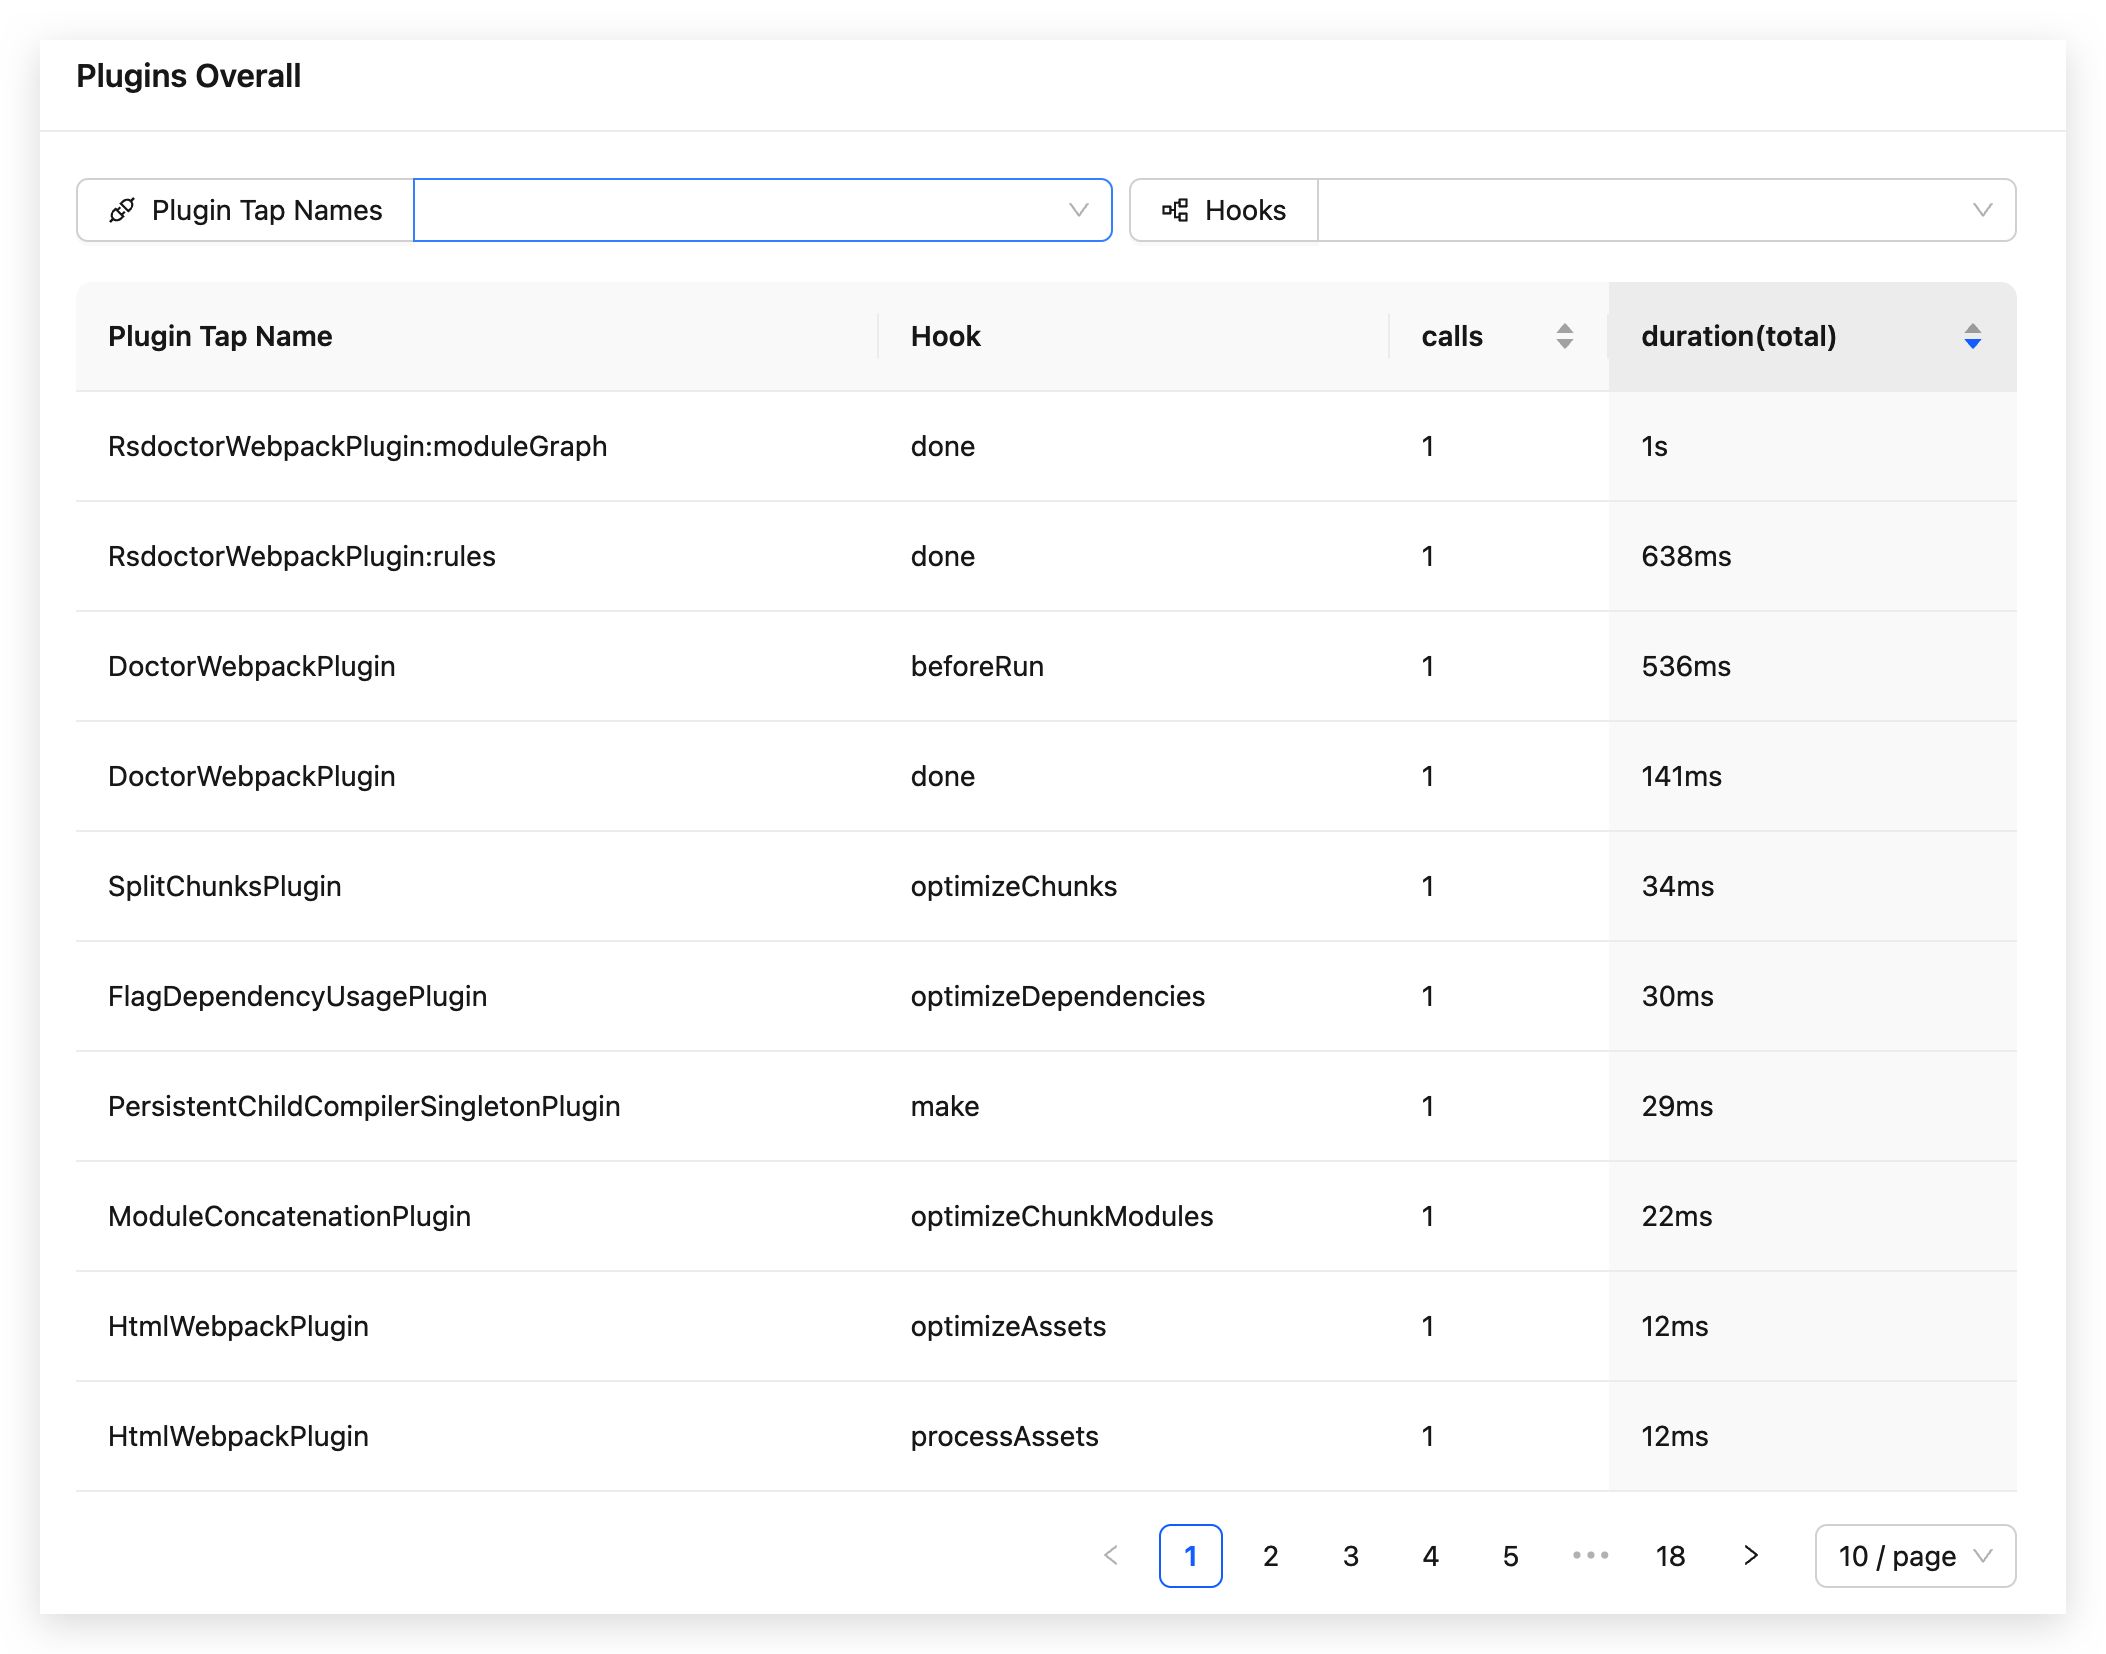
In the Rsdoctor Compile Analysis secondary page Plugins Analysis, we can see the invocation data of all Compiler Hooks and Compilation Hooks used by the current Rspack or Webpack project. The content is shown in the following figure:
TIP
The plugin time will also calculate the internal plugin time of Rsdoctor.
Glossary
The meanings of the fields in the data statistics table on the page are as follows:
| Term | Description |
|---|---|
| Plugin Tap Name | Represents the name value when .tap is called |
| Hook | Represents the hook name |
| calls | Represents the number of times called |
| duration(total) | Represents the total time of all calls |
Usage Instructions
View Builder Config
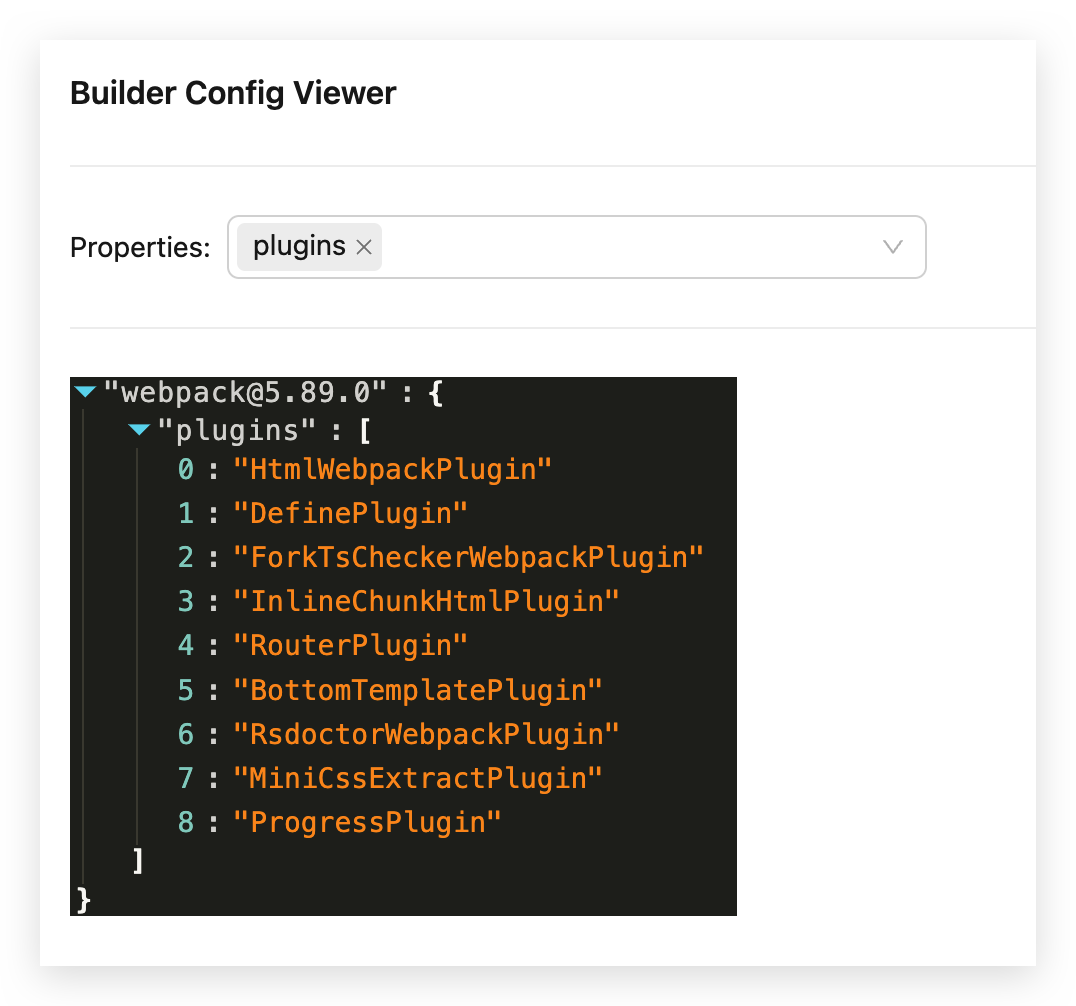
If we need to view the Webpack configuration of the project, we can click on View Builder Config in the upper right corner of the card. A floating layer will pop up, which contains the serialized Builder Config, as shown in the following figure:
Reference Documentation
ON THIS PAGE